Excel's Choose Your Own Adventure: Scenario Manager
Navigate the world of Excel's Scenario Manager with our guide - no compass or survival skills necessary!
This is the second in a 4 part series on Excel’s What-If analysis tools.
Want to get the most out of this newsletter? Download the sample data so that you can follow along.
Today we will pick up on the second part of this series on how to use Excel’s What-If analytic tools. Today we move on from Data Tables and onto the What-If Analysis Scenario Manager.
As useful as data tables are, they do have their limits:
You can only vary 1-2 input cells at a time
Even a 2 input table references a single formula.
Sometimes you just want a few combinations, not an entire tables worth.
Scenario Manager allows you to create and compare different scenarios with different input values. It's like a 'Choose Your Own Adventure' book, but for your business. You can see the outcomes of different scenarios side by side, making forecasting and budgeting a breeze. You can store different sets of input values for any number of variables. Scenario Manager will also generate a report summarizing the impact of different combinations. It can even summarize the data into a Pivot Table report.
Manufacturing Projections Example
Lets take a look at a very common application for scenario manager - Manufacturing Projections. These types of businesses often have to manage a balance of resource costs, manufacturing costs, and market pricing. The low margin/high volume nature make scenario analysis an important aspect to decision making.
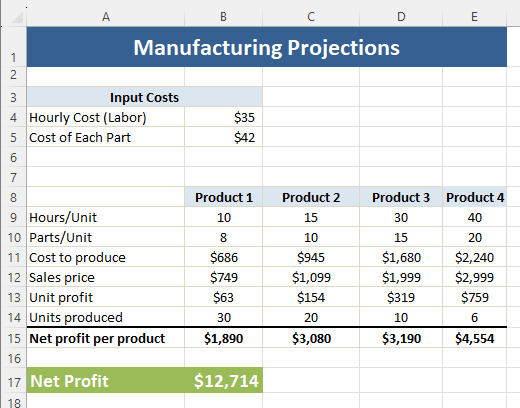
Here is an example of a Manufacturing Projections sheet. This company builds 3 products. Each with varying labor and materials needs. Each product also has different market sizes. Here are the projections currently:
There are two input cells B4 & B5. The table takes into account these variables and will calculate the net profit for each product, and also for the manufacturer.
Create a Scenario Table
This is where things can get really challenging for folks making decisions. We always look at 3 scenarios: Best, worst, most likely. We do this because we need to ensure that our plans take into account the worst things that can happen while also considering the upside potential of our decisions. Both of these need to be compared against what we really believe will happen. For this example, the following scenario table was built out:
Using Scenario Manager
The challenge is reconciling these scenarios against the Manufacturing Projections. This is where scenario manager comes into play.
Step 1:
Open the Scenario Manager dialogue box. Go to Data > Forecast > What-if Analysis > Scenario Manager.
Step 2:
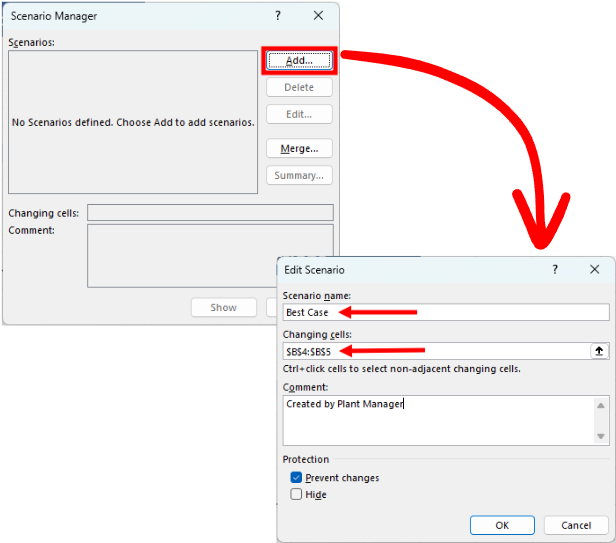
Once the Scenario Manager prompt is open we want to click “Add” in order to add a scenario. In the Edit Scenario prompt we want to enter a Scenario Name, and the cells that will be changing. In this case the cells are B4 & B5.
Step 3:
Another prompt window will open. In this window we will enter the Scenario Values for the “Best Case” from our Scenario Table. Then hit OK.
Step 4:
Repeat steps 2 & 3 for the Worst Case and Most Likely scenarios as well.
Step 5:
To view your results you can simply click on a scenario, then click on show. The table will automatically update to each scenario.
Best case:
Worst Case:
Most Likely:
Wow! What a range of outcomes. It really stresses the importance of running your operations properly. If costs change it could be the difference between solid returns and losses.
Adding a drop down list
It’s pretty great to be able to review scenarios in this way. Lets add a drop down list into our Quick Access Toolbar (QAT). This will allow us to adjust the scenarios without having to dive into the scenario manager prompt every time.
Step 1: Right click the QAT & choose customize.
Step 2: Go to Customize Toolbar > Commands Not in the Ribbon > Scenario. Click Add then select OK.
Step 3: You can now use the Scenario pull down to scroll through your scenario options without going into the Scenario Manager prompt.
Creating a Scenario Report
While it is nice to be able to swing between the different scenarios, this isn’t ideal when publishing in a slide deck or report. Scenario manager gives you the option of creating a Scenario Summary Report OR a Scenario Pivot table report for just this purpose. This is also a time where the Name Manger comes in pretty handy Here is how you create it.
Step 1: Open Name Manger. Formula > Defined Names > Name Manger
Step 2: Add names to the cells for all input and outputs that you are interested in learning about:
Step 3: Go back into the Scenario Manager Menu. Select “Summary”
Step 4: Scenario Manager will ask you to choose between a Scenario Summary OR a Scenario Pivot Table Report. Make your selection.
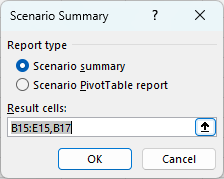
Step 5: The result cells are the cells that contain the end results you are looking for. In this case we want to know the net profit per product and also the Net Profit as a whole. We will select cells B15:E15, B17. Then hit Ok
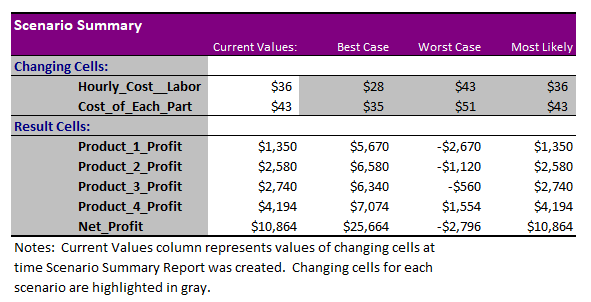
In this case I selected Scenario Summary. The scenario manager will create a brand new worksheet in the workbook and place the Scenario Summary report in there. Because we labeled the cells using the Name Manager the names in the Changing Cells & the Result Cells come out clear.
If I choose Scenario Pivot Table Report instead this would be my output:
Utilizing Excels What-If Analysis Scenario Manger can help you manage decisions by balancing multiple inputs & outputs at the same time. I have found this to be especially useful when trying to balance out ever changing market prices for raw goods and services against an existing manufacturing facility. Make sure you becomes familiar with this feature of Excel…it will surely set you apart in any meeting. I have made this easy for you as well - be sure to download the sample data sheet at the top of this lesson. That way you can learn and practice at the same time!
I hope this lesson has given you a fresh perspective on how to use Excel more effectively. Remember, it's not about working harder; it's about working smarter. And Excel’s What-If Scenario Manager is a tool that helps you do just that. Be on the lookout for next weeks newsletter where we will cover another What-if Analysis tool - Goal Seek.
I hope you enjoyed this lesson. There are a few other ways I can help you master Excel:
Do you have any burning questions about Excel that you want answered? Send your question to hello@learnexcel.live. I will address it in a future newsletter.
Do you or your organization need a little spreadsheet help? Book a 1 on 1 with me here.
Want to learn more Excel Shortcuts? I have created something special (and free) for you: The Best Damn Excel Shortcut Sheet
Til next time ✌️
-Ajay
The Excel Ninja 🥷
PS - If you like these lessons please share with a friend or two...


